Data manipulation
Sara Mortara & Andrea Sánchez-Tapia
re.green | ¡liibre!
2022-07-12
today
data
relational data bases
manipulating data in R
data

data and data structure
- knowledge comes from synthesizing multiples perspectives
data and data structure
knowledge comes from synthesizing multiples perspectives
every data have a context
data and data structure
knowledge comes from synthesizing multiples perspectives
every data have a context
data cleanning
- insistence on tidiness, cleanliness, and order
- idea of data scientists as wizards or janitors
data and data structure
knowledge comes from synthesizing multiples perspectives
every data have a context
data cleanning
- insistence on tidiness, cleanliness, and order
- idea of data scientists as wizards or janitors
- ideas that data should always be clean and controlled have tainted historical roots
organizing data
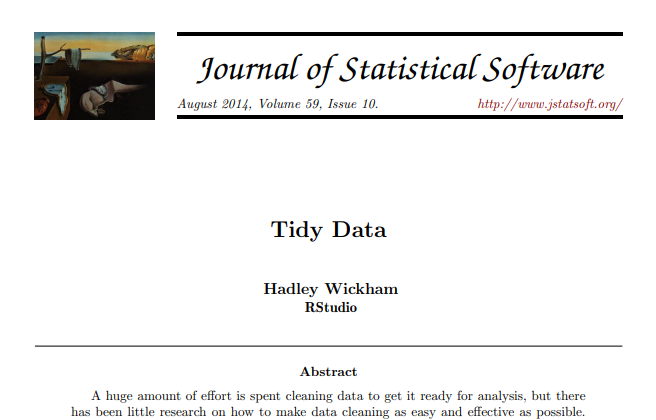
organizing data
- manipulating data in rows and columns
- data tidying: structuring datasets to facilitate analysis
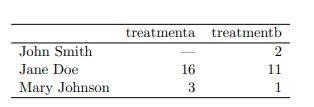
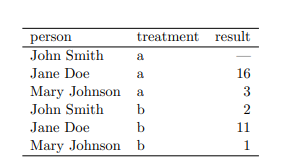
organizing data: tidy
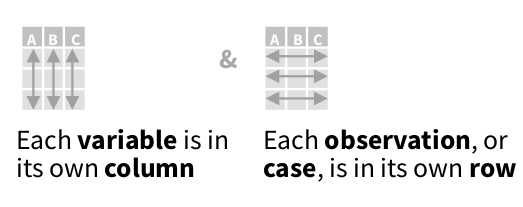
each column a variable
each row an observation
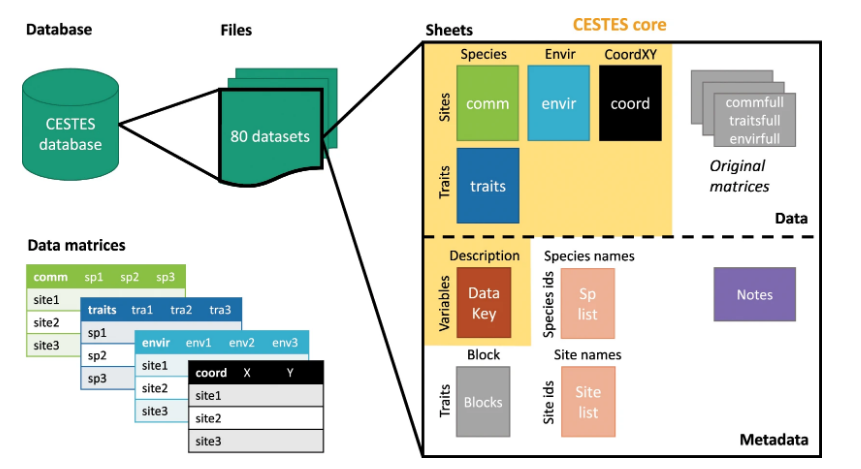
relational data bases
relational data bases
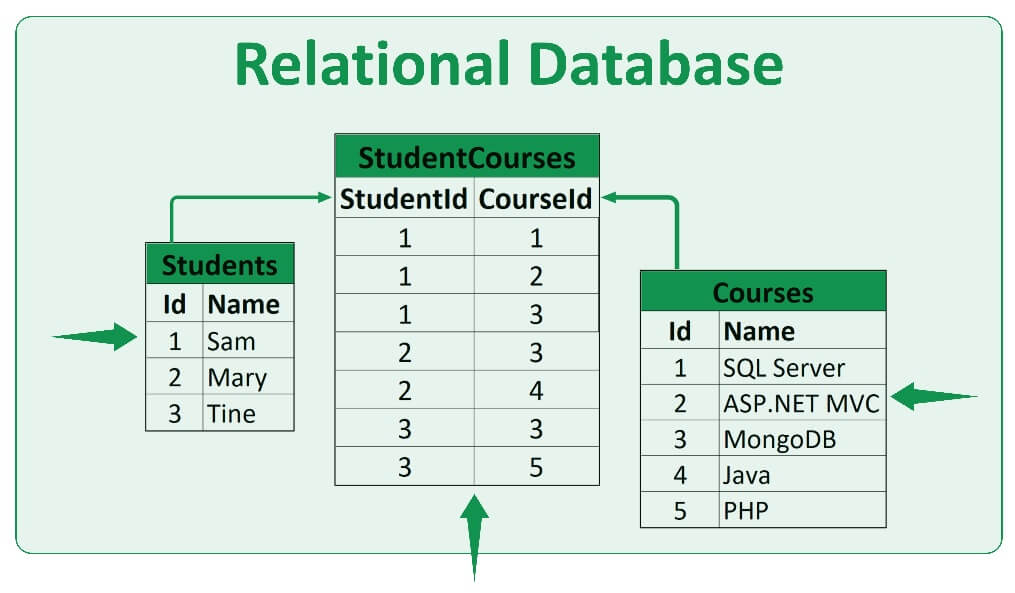
- different data are organized in different tables
relational data bases
different data are organized in different tables
tables are integrated
relational data bases
different data are organized in different tables
tables are integrated
common identifier for each table
relational data bases
different data are organized in different tables
tables are integrated
common identifier for each table
in general organized in SQL (Structured Query Language)
dealing with relational data
- tipically data analysis in different tables
dealing with relational data
tipically data analysis in different tables
relations between tables are pairwised
dealing with relational data
tipically data analysis in different tables
relations between tables are pairwised
relations of three or more tables are always properties of pairwise relationships
dealing with relational data
tipically data analysis in different tables
relations between tables are pairwised
relations of three or more tables are always properties of pairwise relationships
verbs to work with pairs of tables
types of verbs
- mutating
types of verbs
mutating
filtering
types of verbs
mutating
filtering
set operations
types of verbs
mutating
filtering
set operations
data manipulation can be done using packages base and dplyr
dplyr package
based on relational data bases logic
- easier than SQL because it is focused on data analysis
dplyr package
based on relational data bases logic
easier than SQL because it is focused on data analysis
grammar for data manipulation
dplyr package
based on relational data bases logic
easier than SQL because it is focused on data analysis
grammar for data manipulation
mutate()
dplyr package
based on relational data bases logic
easier than SQL because it is focused on data analysis
grammar for data manipulation
mutate()filter()
dplyr package
based on relational data bases logic
easier than SQL because it is focused on data analysis
grammar for data manipulation
mutate()filter()
data structure
keys
keys
- a key indicates an unique observation
keys
- a key indicates an unique observation
- primary key --> identifies an observation in its own table
keys
- a key indicates an unique observation
primary key --> identifies an observation in its own table
foreign key --> identifies an observation in another table
keys
- a key indicates an unique observation
primary key --> identifies an observation in its own table
foreign key --> identifies an observation in another table
a variable can be a primary key in one table and a foreign key in another
keys
- a key indicates an unique observation
primary key --> identifies an observation in its own table
foreign key --> identifies an observation in another table
a variable can be a primary key in one table and a foreign key in another
every primary key must contain unique information!
keys
- a key indicates an unique observation
primary key --> identifies an observation in its own table
foreign key --> identifies an observation in another table
a variable can be a primary key in one table and a foreign key in another
every primary key must contain unique information!
every table must have a primary key
relation
is given by primary key and its respective foreign key
- 1-to-many
- 1-to-1
- we use the keys to combine tables
- we use
merge()(base) orjoin()(dplyr)

using relationships to join data

equivalences between dplyr and base

manipulating data in R
open data and code
open data and code
open data and code

todo
create and run
03_data_manipulation.Rgenerate outputs
git add,commit, andpush
a workflow in R
loading needed packages
library("reshape2")library("tidyverse")exploring the data
species vs. sites
files_path <- list.files("data/raw/cestes/", pattern = ".csv", full.names = TRUE)files_path## [1] "data/raw/cestes//comm.csv" "data/raw/cestes//coord.csv" ## [3] "data/raw/cestes//envir.csv" "data/raw/cestes//splist.csv"## [5] "data/raw/cestes//traits.csv"files_path[3]## [1] "data/raw/cestes//envir.csv"reading the data in R
creating data.frame objects
comm <- read.csv(files_path[1])coord <- read.csv(files_path[2])envir <- read.csv(files_path[3])splist <- read.csv(files_path[4])traits <- read.csv(files_path[5])inspecting the community data
comm[1:6, 1:10]## Sites sp1 sp2 sp3 sp4 sp5 sp6 sp7 sp8 sp9## 1 1 0 0 0 0 0 0 0 1 0## 2 2 0 1 0 0 0 0 0 0 0## 3 3 0 1 0 0 0 0 0 0 2## 4 4 0 0 0 0 0 0 0 0 0## 5 5 0 0 0 0 0 0 0 0 0## 6 6 0 0 0 0 0 0 0 0 0inspecting traits data
traits[1:9, 1:7]## Sp Anemo Auto Entomo Annual Biennial Perennial## 1 sp1 0 0 1 0 0 1## 2 sp2 0 0 1 0 0 1## 3 sp3 0 0 1 1 1 1## 4 sp4 0 0 1 0 0 1## 5 sp5 0 0 1 0 0 1## 6 sp6 0 0 1 0 0 1## 7 sp7 0 0 1 0 0 1## 8 sp8 0 0 1 0 0 1## 9 sp9 1 0 0 0 0 1inspecting environmental data
head(envir)## Sites Clay Silt Sand K2O Mg Na100g K Elev## 1 1 0.73 0.24 0.03 1.3 9.2 4.2 1.2 6## 2 2 0.75 0.24 0.02 0.8 10.7 10.4 1.4 2## 3 3 0.74 0.24 0.02 1.7 8.6 10.8 1.9 2## 4 4 0.23 0.26 0.49 0.3 2.0 1.2 0.3 6## 5 5 0.73 0.24 0.03 1.3 9.2 4.2 1.2 6## 6 6 0.72 0.22 0.03 1.7 6.0 10.7 1.3 4inspecting coordenate data
head(coord)## Sites X Y## 1 1 365.80 181.20## 2 2 349.60 185.00## 3 3 333.40 185.40## 4 4 373.86 161.43## 5 5 380.25 179.50## 6 6 354.40 168.60inspecting the species list data
head(splist)## TaxonName Taxon TaxCode## 1 Arisarum vulgare Arvu sp1## 2 Alisma plantago Alpl sp2## 3 Damasonium alisma Daal sp3## 4 Asphodelus aetivus Asae sp4## 5 Narcissus tazetta Nata sp5## 6 Narcissus elegans Nael sp6# how many species?nrow(splist)## [1] 56adding coordinates in the site data.frame
# info on coordnames(coord)## [1] "Sites" "X" "Y"dim(coord)## [1] 97 3# info on envirnames(envir)## [1] "Sites" "Clay" "Silt" "Sand" "K2O" "Mg" "Na100g" "K" ## [9] "Elev"dim(envir)## [1] 97 9using merge and a common column
the common column is primary and foreign key
envir_coord <- merge(x = envir, y = coord, by = "Sites")dim(envir_coord)## [1] 97 11checking the merge
names(envir_coord)## [1] "Sites" "Clay" "Silt" "Sand" "K2O" "Mg" "Na100g" "K" ## [9] "Elev" "X" "Y"transforming the species matrix vs. area in data table (tidy data)
comm[1:6, 1:10]## Sites sp1 sp2 sp3 sp4 sp5 sp6 sp7 sp8 sp9## 1 1 0 0 0 0 0 0 0 1 0## 2 2 0 1 0 0 0 0 0 0 0## 3 3 0 1 0 0 0 0 0 0 2## 4 4 0 0 0 0 0 0 0 0 0## 5 5 0 0 0 0 0 0 0 0 0## 6 6 0 0 0 0 0 0 0 0 0using the package reshape2
# converting the matrix into tidy datacomm_df <- reshape2::melt(comm[, -1])## No id variables; using all as measure variables# checking if it workedhead(comm_df)## variable value## 1 sp1 0## 2 sp1 0## 3 sp1 0## 4 sp1 0## 5 sp1 0## 6 sp1 0using the package reshape2
# how many the times the species repeatstable(comm_df$variable)## ## sp1 sp2 sp3 sp4 sp5 sp6 sp7 sp8 sp9 sp10 sp11 sp12 sp13 sp14 sp15 sp16 ## 97 97 97 97 97 97 97 97 97 97 97 97 97 97 97 97 ## sp17 sp18 sp19 sp20 sp21 sp22 sp23 sp24 sp25 sp26 sp27 sp28 sp29 sp30 sp31 sp32 ## 97 97 97 97 97 97 97 97 97 97 97 97 97 97 97 97 ## sp33 sp34 sp35 sp36 sp37 sp38 sp39 sp40 sp41 sp42 sp43 sp44 sp45 sp46 sp47 sp48 ## 97 97 97 97 97 97 97 97 97 97 97 97 97 97 97 97 ## sp49 sp50 sp51 sp52 sp53 sp54 sp55 sp56 ## 97 97 97 97 97 97 97 97creating the variable "Sites"
# how many species?n_sp <- nrow(splist)n_sp## [1] 56# vector containing all sitesSites <- envir$Siteslength(Sites)## [1] 97comm_df$Sites <- rep(Sites, each = n_sp)checking if the first column was created
head(comm_df)## variable value Sites## 1 sp1 0 1## 2 sp1 0 1## 3 sp1 0 1## 4 sp1 0 1## 5 sp1 0 1## 6 sp1 0 1changing column names
names(comm_df)## [1] "variable" "value" "Sites"names(comm_df)[1:2] <- c("TaxCode", "Abundance")head(comm_df)## TaxCode Abundance Sites## 1 sp1 0 1## 2 sp1 0 1## 3 sp1 0 1## 4 sp1 0 1## 5 sp1 0 1## 6 sp1 0 1using R base
let's add a column with the species name to our comm_df object
comm_sp <- merge(x = comm_df, y = splist[, c(1, 3)], by = "TaxCode")using packages dplyr e tidyr
let's add a column with the species name to our comm_df object
comm_sp <- inner_join(x = comm_df, y = splist[, c(1, 3)])## Joining, by = "TaxCode"checking our new column
head(comm_sp)## TaxCode Abundance Sites TaxonName## 1 sp1 0 1 Arisarum vulgare## 2 sp1 0 1 Arisarum vulgare## 3 sp1 0 1 Arisarum vulgare## 4 sp1 0 1 Arisarum vulgare## 5 sp1 0 1 Arisarum vulgare## 6 sp1 0 1 Arisarum vulgareusing the package tidyr
comm_tidy <- tidyr::pivot_longer(comm, cols = 2:ncol(comm), names_to = "TaxCode", values_to = "Abundance")head(comm_tidy)## # A tibble: 6 × 3## Sites TaxCode Abundance## <int> <chr> <int>## 1 1 sp1 0## 2 1 sp2 0## 3 1 sp3 0## 4 1 sp4 0## 5 1 sp5 0## 6 1 sp6 0dim(comm_tidy)## [1] 5432 3joining all variables into a single table
binding comm_sp with envir.coord
comm_envir <- inner_join(x = comm_sp, y = envir_coord, by = "Sites")dim(comm_sp)## [1] 5432 4dim(envir_coord)## [1] 97 11dim(comm_envir)## [1] 5432 14writing final table
write.csv("comm_envir", "data/processed/03_Pavoine_full_table.csv", row.names = FALSE)