Exploratory data analysis
Sara Mortara & Andrea Sánchez-Tapia
re.green | ¡liibre!
2022-07-13
today
exploratory data analysis
descriptive statistics
exploratory graphics
variable relationships
Explanatory Data Analysis - John Tukey

get to know your data!

goals of EDA
- control data quality
goals of EDA
control data quality
suggest hypotheses for observed patterns
goals of EDA
control data quality
suggest hypotheses for observed patterns
support the choice of statistical procedures for hypothesis testing
goals of EDA
control data quality
suggest hypotheses for observed patterns
support the choice of statistical procedures for hypothesis testing
assess whether the data meet the assumptions of the chosen statistical procedures
goals of EDA
control data quality
suggest hypotheses for observed patterns
support the choice of statistical procedures for hypothesis testing
assess whether the data meet the assumptions of the chosen statistical procedures
indicate new studies and hypotheses
alert!
EDA does not mean
it is assumed that the researcher has formulated a priori hypotheses supported by theory
tips
- there is no recipe!
tips
there is no recipe!
can take between 20-50% of analysis time
tips
there is no recipe!
can take between 20-50% of analysis time
can be started during data collection
tips
there is no recipe!
can take between 20-50% of analysis time
can be started during data collection
visual techniques are widely used
tips
there is no recipe!
can take between 20-50% of analysis time
can be started during data collection
visual techniques are widely used
the importance of graphics and the Anscombe quartet
- created by mathematician Francis Ascombe
the importance of graphics and the Anscombe quartet
created by mathematician Francis Ascombe
4 datasets with the same descriptive statistics but very different graphically

Anscombe data
# the dataset already exists inside Rdata("anscombe")# meanapply(anscombe, 2, var)## x1 x2 x3 x4 y1 y2 y3 y4 ## 11.000000 11.000000 11.000000 11.000000 4.127269 4.127629 4.122620 4.123249# varianceapply(anscombe, 2, var)## x1 x2 x3 x4 y1 y2 y3 y4 ## 11.000000 11.000000 11.000000 11.000000 4.127269 4.127629 4.122620 4.123249let's take a look into the data
## x1 x2 x3 x4 y1 y2 y3 y4## 1 10 10 10 8 8.04 9.14 7.46 6.58## 2 8 8 8 8 6.95 8.14 6.77 5.76## 3 13 13 13 8 7.58 8.74 12.74 7.71## 4 9 9 9 8 8.81 8.77 7.11 8.84## 5 11 11 11 8 8.33 9.26 7.81 8.47## 6 14 14 14 8 9.96 8.10 8.84 7.04## 7 6 6 6 8 7.24 6.13 6.08 5.25## 8 4 4 4 19 4.26 3.10 5.39 12.50## 9 12 12 12 8 10.84 9.13 8.15 5.56## 10 7 7 7 8 4.82 7.26 6.42 7.91## 11 5 5 5 8 5.68 4.74 5.73 6.89correltion between x and y
# correlationcor(anscombe$x1, anscombe$y1)## [1] 0.8164205cor(anscombe$x2, anscombe$y2)## [1] 0.8162365cor(anscombe$x3, anscombe$y3)## [1] 0.8162867cor(anscombe$x4, anscombe$y4)## [1] 0.8165214coefficients of the linear model
# correlationcoef(lm(anscombe$x1 ~ anscombe$y1))## (Intercept) anscombe$y1 ## -0.9975311 1.3328426coef(lm(anscombe$x2 ~ anscombe$y2))## (Intercept) anscombe$y2 ## -0.9948419 1.3324841coef(lm(anscombe$x3 ~ anscombe$y3))## (Intercept) anscombe$y3 ## -1.000315 1.333375coef(lm(anscombe$x4 ~ anscombe$y4))## (Intercept) anscombe$y4 ## -1.003640 1.333657now let's actually look into the Anscombe data

guiding questions
- Where is the data centered? How is the data distributed? Are the data symmetrical, asymmetrical, bimodal?
guiding questions
Where is the data centered? How is the data distributed? Are the data symmetrical, asymmetrical, bimodal?
Are there outliers?
guiding questions
Where is the data centered? How is the data distributed? Are the data symmetrical, asymmetrical, bimodal?
Are there outliers?
Do the variables follow a normal distribution?
guiding questions
Where is the data centered? How is the data distributed? Are the data symmetrical, asymmetrical, bimodal?
Are there outliers?
Do the variables follow a normal distribution?
Are there relationships between the variables? Are the relationships between variables linear?
guiding questions
Where is the data centered? How is the data distributed? Are the data symmetrical, asymmetrical, bimodal?
Are there outliers?
Do the variables follow a normal distribution?
Are there relationships between the variables? Are the relationships between variables linear?
Do variables need to be transformed?
Was the sampling effort the same for each observation or variable?
descriptive statistics
questions to ask the data
are there are missing values i.e. (NAs)? Are they really missing?
area there many zeroes?
where is the data centered? how are they spread? are they symmetrical? skewed, bimodal?
are there extreme values (outliers)?
what is the distribution of the variable?
descriptive statistics
| Parameter | Description | R function |
|---|---|---|
| average | arithmetic mean | mean() |
| median | core value | median() |
| mode | most frequent value | sort(table(), decreasing = TRUE)[1] |
| standard deviation | variation around the mean | sd() |
| quantiles | cut points dividing a probability distribution | quantile() |
exploratory graphics
reading data in R
# reading data generated in the last classall_data <- read.csv("data/processed/03_Pavoine_full_table.csv")# reading environmental dataenvir <- read.csv("data/raw/cestes/envir.csv")# environmental data without siteenvir.vars <- envir[, -1]visualizing data in a boxplot
boxplot(all_data$Abundance)
going back to the data
summary(all_data$Abundance)## Min. 1st Qu. Median Mean 3rd Qu. Max. ## 0.0000 0.0000 0.0000 0.1788 0.0000 6.0000# how many zeroessum(all_data$Abundance == 0)## [1] 4824# what proportion?sum(all_data$Abundance == 0)/nrow(all_data)## [1] 0.8880707understanding the boxplot

visualizing data in a histogram
hist(all_data$Abundance)
types of histogram
par(mfrow = c(1,2))hist(all_data$Abundance)hist(all_data$Abundance, probability = TRUE)
par(mfrow = c(1,1))classes of histogram
par(mfrow = c(1,3))hist(all_data$Abundance, breaks = seq(0, max(all_data$Abundance), length = 3))hist(all_data$Abundance, breaks = seq(0, max(all_data$Abundance), length = 5))hist(all_data$Abundance)
par(mfrow = c(1,1))empirical probability density curves
represents the function that describes the probability of finding a certain value
hist(all_data$Abundance, probability = TRUE )
empirical probability density curves
plot(density(all_data$Abundance))
does the distribution fit the data?
discrete and asymmetric distribution --> Poisson?
# maximum of abundanceab.max <- max(all_data$Abundance)# lambdaab.med <- mean(all_data$Abundance)does the Poisson distribution fit the data?
hist(all_data$Abundance, probability = TRUE)points(dpois(0:ab.max, ab.med), col = cor[5])lines(dpois(0:ab.max, ab.med), col = cor[5])
statistical distributions: Gaussian or normal

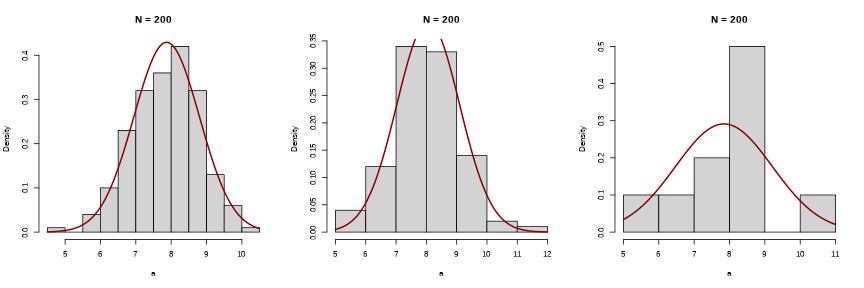
why is sampling important?
relationships between variables
scatter plot
plot(Clay ~ Silt, data = envir.vars, pch = 19)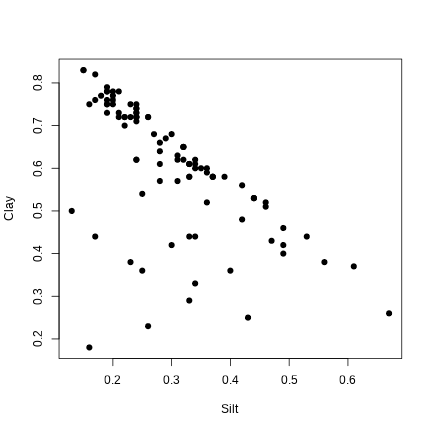
correlation between variables
cor(envir.vars)## Clay Silt Sand K2O Mg Na100g## Clay 1.0000000 -0.62694838 -0.71786978 0.4422121 0.18895961 0.28623195## Silt -0.6269484 1.00000000 -0.07660720 -0.2388823 -0.02370373 0.02738666## Sand -0.7178698 -0.07660720 1.00000000 -0.3364384 -0.21930954 -0.37588031## K2O 0.4422121 -0.23888226 -0.33643842 1.0000000 0.33549979 0.25314016## Mg 0.1889596 -0.02370373 -0.21930954 0.3354998 1.00000000 0.41377118## Na100g 0.2862320 0.02738666 -0.37588031 0.2531402 0.41377118 1.00000000## K 0.5436153 -0.32123692 -0.40584268 0.5681411 0.41177702 0.57075510## Elev -0.1485992 0.08087163 0.09379561 -0.1767765 -0.22314328 -0.33392061## K Elev## Clay 0.5436153 -0.14859923## Silt -0.3212369 0.08087163## Sand -0.4058427 0.09379561## K2O 0.5681411 -0.17677652## Mg 0.4117770 -0.22314328## Na100g 0.5707551 -0.33392061## K 1.0000000 -0.33251202## Elev -0.3325120 1.00000000correlation between variables
pairs(envir.vars)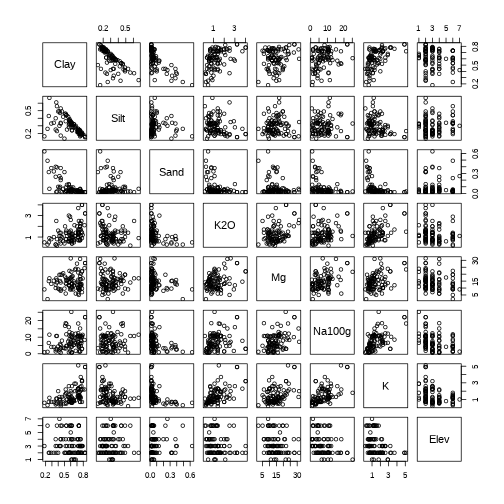
even better visualization

and what are the paths for the data analysis?
your [ H Y P O T H E S I S ]
after the [ H Y P O T H E S I S ], what are the paths?
- understand the data well
after the [ H Y P O T H E S I S ], what are the paths?
understand the data well
variable response is normal? --> lm and other parametric analysis
after the [ H Y P O T H E S I S ], what are the paths?
understand the data well
variable response is normal? --> lm and other parametric analysis
variable response has another distribution --> non-parametric analysis, glm
after the [ H Y P O T H E S I S ], what are the paths?
understand the data well
variable response is normal? --> lm and other parametric analysis
variable response has another distribution --> non-parametric analysis, glm
hierarchical predictor variables? --> (g)lmm
after the [ H Y P O T H E S I S ], what are the paths?
understand the data well
variable response is normal? --> lm and other parametric analysis
variable response has another distribution --> non-parametric analysis, glm
hierarchical predictor variables? --> (g)lmm
pseudo-replication in space or time --> (g)lmm
todo
create and run script
04_eda.Rgit add,commit, andpushof the day