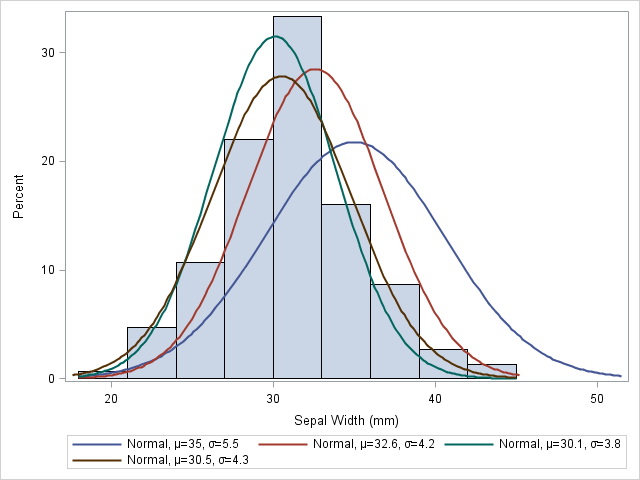
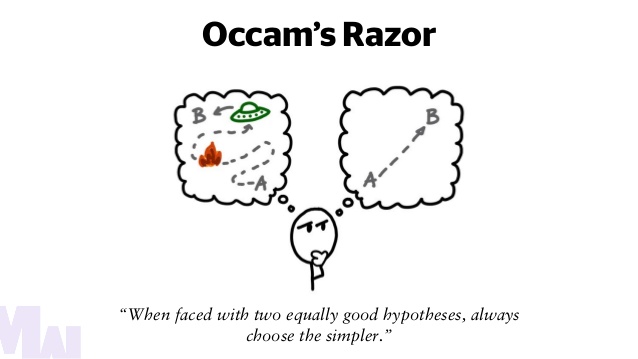
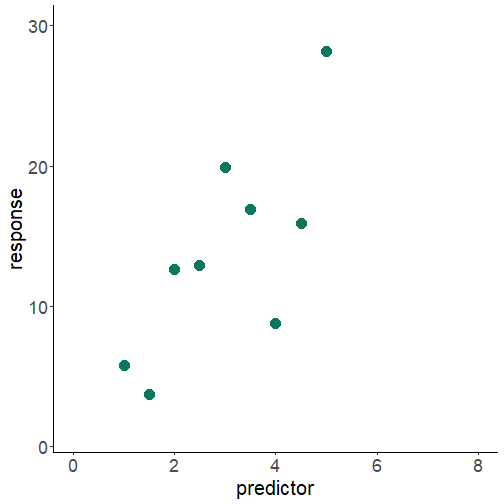
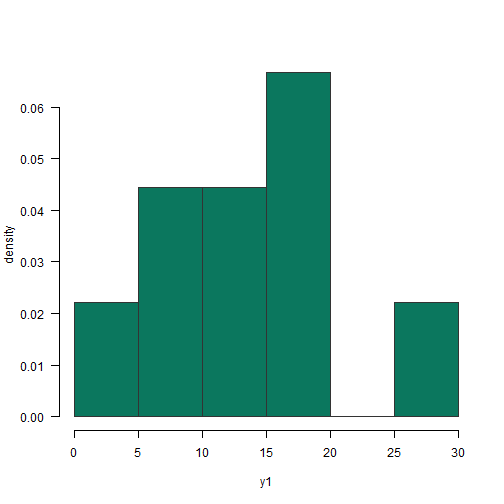
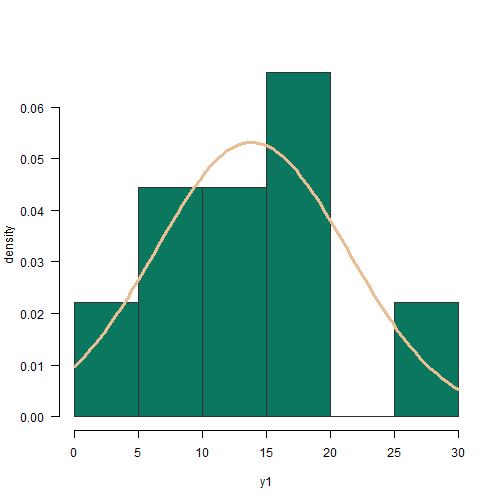
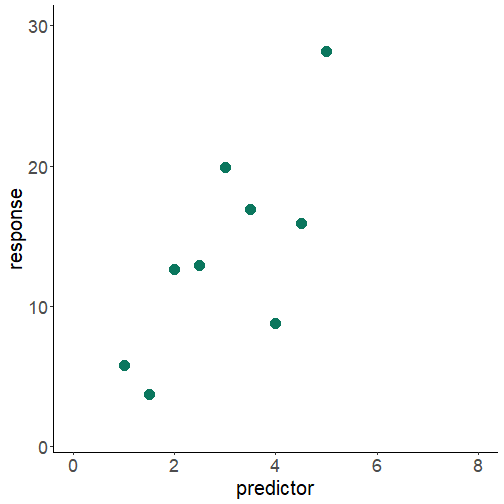
class: center, middle, inverse, title-slide .title[ # Statistical modeling ] .author[ ### Sara Mortara & Andrea Sánchez-Tapia ] .institute[ ### re.green | ¡liibre! ] .date[ ### 2022-07-19 ] --- <style type="text/css"> .tiny .remark-code { /*Change made here*/ font-size: 50% !important; } </style> ## about 1. concepts in statistical modeling 2. probability distributions 3. the linear model --- class: center, middle, inverse # 1. concepts in statistical modellng --- class: center, middle, inverse # connect theory with data using statistical models --- ## best references .pull-left[ <img src="figs/ecological_detective.jpg" width="300" style="display: block; margin: auto;" /> ] .pull-left[ <img src="figs/burnham_anderson.jpeg" width="300" style="display: block; margin: auto;" /> ] --- ## best references .pull-left[ <img src="figs/ben_bolker.jpg" width="300" style="display: block; margin: auto;" /> ] .pull-left[ <img src="figs/ecological_statistics.jpg" width="300" style="display: block; margin: auto;" /> ] --- ## model & data - data are not sacrossanct - search for a minimal and suitable model <img src="figs/noun-regression-analysis-2009607.png" width="30%" style="display: block; margin: auto;" /> --- ## the data - continuous or dicrete variable? - how many replicates? - what are the predictor variables? - what is the pattern? -- ## concepts - maximum likelihood - principle of parsimony - Ocram's razor --- ## maximum likelihood given the data and the model: what are the parameter values that make the data more plausible? <img src="figs/mlenormal.png" width="50%" style="display: block; margin: auto;" /> --- ## principle of parsimony .pull-left[ > all things being equal, the simpler solution is the best William of Occam ] .pull-right[ <img src="figs/occams_razor.jpg" width="851" /> ] --- ## principle of parsimony - models with fewer possible parameters - linear models preferable to non-linear - less assumptions - minimally adequate models - simpler explanations <img src="figs/model_fit.png" width="110%" style="display: block; margin: auto;" /> --- ## best model is just a model - all models are wrong <img src="figs/melting_face.png" width="41" /> - some models are better than others - we are never sure of the correct model - the simpler the model, the better -- but not simplistic <img src="figs/nailed_it.jpeg" width="50%" style="display: block; margin: auto;" /> --- class: center, middle, invert # 2. statistical distributions --- ## statistical distributions .tiny[ distribution | type | `\(E(X)\)` | `\(\sigma^2(X)\)` | usage | example ------------- | -----| -------|-----------|----------|------------- normal | continuous | `\(\mu\)` | `\(\sigma^2\)` | Symmetric curve for continuous data | size distribution binomial | discrete | `\(np\)` | `\(np(1-p)\)` | Number of successes in `\(n\)` attempts | Presence or absence of species Poisson | discrete | `\(\lambda\)` | `\(\lambda\)` | Independent rare events where `\(\lambda\)` is the rate at which the event occurs in space or time | Distribution of rare species in space Log-normal | continuous | `\(log(\mu)\)` | `\(log(\sigma^2)\)` | Asymmetric curve | Species abundance distribution ] --- ## continuous distributions ```r df_n <- data.frame(val = rnorm(1000, mean = 0, sd = 1)) df_ln <- data.frame(val = exp(rnorm(1000))) ``` --- ## continuous distributions .pull-left[ <img src="07_slides_files/figure-html/unnamed-chunk-11-1.png" style="display: block; margin: auto;" /> ] .pull-right[ <img src="07_slides_files/figure-html/unnamed-chunk-12-1.png" style="display: block; margin: auto;" /> ] --- class: center, middle, inverse # 3. the linear model mathematical model + uncertainty: `\(Y = a + bx + \epsilon\)` --- ## statistical model <img src="07_slides_files/figure-html/themodel-1.png" style="display: block; margin: auto;" /> --- ## relation between variables: prediction <img src="07_slides_files/figure-html/unnamed-chunk-13-1.png" style="display: block; margin: auto;" /> --- ## relation between variables: extrapolation <img src="07_slides_files/figure-html/unnamed-chunk-14-1.png" style="display: block; margin: auto;" /> --- ## the linear model .pull-left[ `$$y = a + bx$$` `$$y = \alpha + \beta X + \epsilon$$` `$$\epsilon = N (0, \sigma)$$` ] .pull-right[ <img src="07_slides_files/figure-html/unnamed-chunk-15-1.png" style="display: block; margin: auto;" /> ] --- ## is the response variable normal? <img src="07_slides_files/figure-html/norm-1.png" width="40%" style="display: block; margin: auto;" /> --- ## is the response variable normal? <img src="07_slides_files/figure-html/norm2-1.png" width="40%" style="display: block; margin: auto;" /> --- ## what is relationship between the predictor and the response variable? <img src="07_slides_files/figure-html/xy-1.png" width="40%" style="display: block; margin: auto;" /> --- ## assumptions + relationship between x and y is linear + normality of residuals + __homoscedasticity__ -- homogeneity of residuals variance + independence of residuals error terms --- ## parameter estimation .pull-left[ - least squares method - maximum likelihood ] .pull-right[ ![](figs/noun-parameters-4125642.svg)<!-- --> ] --- ## least squares method <img src="07_slides_files/figure-html/unnamed-chunk-17-1.png" style="display: block; margin: auto;" /> --- ## least squares method <img src="07_slides_files/figure-html/unnamed-chunk-18-1.png" style="display: block; margin: auto;" /> --- ## least squares method <img src="07_slides_files/figure-html/unnamed-chunk-19-1.png" style="display: block; margin: auto;" /> --- ## least squares method <img src="07_slides_files/figure-html/unnamed-chunk-20-1.png" style="display: block; margin: auto;" /> --- ## linear model in R .tiny[ ```r mod <- lm(y1 ~ x1) summary(mod) ``` ``` ## ## Call: ## lm(formula = y1 ~ x1) ## ## Residuals: ## Min 1Q Median 3Q Max ## -9.1424 -4.0088 0.9982 2.8714 6.1706 ## ## Coefficients: ## Estimate Std. Error t value Pr(>|t|) ## (Intercept) 1.632 4.520 0.361 0.7287 ## x1 4.076 1.384 2.945 0.0216 * ## --- ## Signif. codes: 0 '***' 0.001 '**' 0.01 '*' 0.05 '.' 0.1 ' ' 1 ## ## Residual standard error: 5.361 on 7 degrees of freedom ## Multiple R-squared: 0.5534, Adjusted R-squared: 0.4895 ## F-statistic: 8.672 on 1 and 7 DF, p-value: 0.02156 ``` ] --- ## uncertainty in the estimate .tiny[ `$$y = 1.63 + 4.08x + \epsilon$$` ] estimation of coefficients .tiny[ ```r coef(mod) ``` ``` ## (Intercept) x1 ## 1.632390 4.075949 ``` ] confidence interval .tiny[ ```r confint(mod) ``` ``` ## 2.5 % 97.5 % ## (Intercept) -9.0566136 12.321394 ## x1 0.8031237 7.348775 ``` ] --- ## linear model residue <img src="07_slides_files/figure-html/unnamed-chunk-24-1.png" style="display: block; margin: auto;" /> --- ## linear model variance partitioning sum of squares from the linear model `$$SS_{total} = SS_{between} + SS_{error}$$` --- ## total sum of squares .pull-left[ `$$SS_{total} = \sum_{i=1}^n (y_{i} - \bar{y})^2$$` ] .pull-right[ <img src="07_slides_files/figure-html/unnamed-chunk-25-1.png" style="display: block; margin: auto;" /> ] --- ## total sum of squares `$$SS_{total} = \sum_{i=1}^n (y_{i} - \bar{y})^2$$` `$$SS_{total} = 450.35$$` --- ## residual sum of squares .pull-left[ `$$SS_{error} = \sum_{i=1}^n (y_{i} - \hat{y}_i)^2$$` ] .pull-right[ <img src="07_slides_files/figure-html/unnamed-chunk-27-1.png" style="display: block; margin: auto;" /> ] --- ## residual sum of squares `$$SS_{error} = \sum_{i=1}^n (y_{i} - \hat{y}_i)^2$$` `$$SS_{error} = 201.15$$` --- ## model sum of squares `$$SS_{total} = SS_{between} + SS_{error}$$` `$$SS_{between} = SS_{total} - SS_{error}$$` `$$SS_{between} = 450.35 - 201.15$$` `$$SS_{between} = 249.2$$` --- ## variance partitioning `$$SS_{total} = 450.35$$` `$$SS_{between} = 249.2$$` `$$SS_{error} = 201.15$$` --- ## variance partitioning __anova table__ .tiny[ ```r anova(mod) ``` ``` ## Analysis of Variance Table ## ## Response: y1 ## Df Sum Sq Mean Sq F value Pr(>F) ## x1 1 249.20 249.200 8.6723 0.02156 * ## Residuals 7 201.15 28.735 ## --- ## Signif. codes: 0 '***' 0.001 '**' 0.01 '*' 0.05 '.' 0.1 ' ' 1 ``` ] --- ## coefficient of determination `\(R^{2}\)` `$$R^2 = \frac{SS_{between}}{SS_total}$$` `$$R^2 = \frac{249.2}{450.35}$$` `$$R^2 = 0.5533$$` --- ## coefficient of determination `\(R^{2}\)` .tiny[ ```r summary(mod) ``` ``` ## ## Call: ## lm(formula = y1 ~ x1) ## ## Residuals: ## Min 1Q Median 3Q Max ## -9.1424 -4.0088 0.9982 2.8714 6.1706 ## ## Coefficients: ## Estimate Std. Error t value Pr(>|t|) ## (Intercept) 1.632 4.520 0.361 0.7287 ## x1 4.076 1.384 2.945 0.0216 * ## --- ## Signif. codes: 0 '***' 0.001 '**' 0.01 '*' 0.05 '.' 0.1 ' ' 1 ## ## Residual standard error: 5.361 on 7 degrees of freedom ## Multiple R-squared: 0.5534, Adjusted R-squared: 0.4895 ## F-statistic: 8.672 on 1 and 7 DF, p-value: 0.02156 ``` ] --- ## todo <svg viewBox="0 0 640 512" style="height:1em;position:relative;display:inline-block;top:.1em;" xmlns="http://www.w3.org/2000/svg"> <path d="M255.03 261.65c6.25 6.25 16.38 6.25 22.63 0l11.31-11.31c6.25-6.25 6.25-16.38 0-22.63L253.25 192l35.71-35.72c6.25-6.25 6.25-16.38 0-22.63l-11.31-11.31c-6.25-6.25-16.38-6.25-22.63 0l-58.34 58.34c-6.25 6.25-6.25 16.38 0 22.63l58.35 58.34zm96.01-11.3l11.31 11.31c6.25 6.25 16.38 6.25 22.63 0l58.34-58.34c6.25-6.25 6.25-16.38 0-22.63l-58.34-58.34c-6.25-6.25-16.38-6.25-22.63 0l-11.31 11.31c-6.25 6.25-6.25 16.38 0 22.63L386.75 192l-35.71 35.72c-6.25 6.25-6.25 16.38 0 22.63zM624 416H381.54c-.74 19.81-14.71 32-32.74 32H288c-18.69 0-33.02-17.47-32.77-32H16c-8.8 0-16 7.2-16 16v16c0 35.2 28.8 64 64 64h512c35.2 0 64-28.8 64-64v-16c0-8.8-7.2-16-16-16zM576 48c0-26.4-21.6-48-48-48H112C85.6 0 64 21.6 64 48v336h512V48zm-64 272H128V64h384v256z"></path></svg> - `lm` tutorial - `git add`, `commit`, and `push` of the day --- class: center, middle # ¡Thanks! <center> <svg viewBox="0 0 512 512" style="position:relative;display:inline-block;top:.1em;fill:#A70000;height:1em;" xmlns="http://www.w3.org/2000/svg"> <path d="M476 3.2L12.5 270.6c-18.1 10.4-15.8 35.6 2.2 43.2L121 358.4l287.3-253.2c5.5-4.9 13.3 2.6 8.6 8.3L176 407v80.5c0 23.6 28.5 32.9 42.5 15.8L282 426l124.6 52.2c14.2 6 30.4-2.9 33-18.2l72-432C515 7.8 493.3-6.8 476 3.2z"></path></svg> [saramortara@gmail.com](mailto:saramortara@gmail.com) | [andreasancheztapia@gmail.com](mailto:andreasancheztapia@gmail.com) <svg viewBox="0 0 512 512" style="position:relative;display:inline-block;top:.1em;fill:#A70000;height:1em;" xmlns="http://www.w3.org/2000/svg"> <path d="M459.37 151.716c.325 4.548.325 9.097.325 13.645 0 138.72-105.583 298.558-298.558 298.558-59.452 0-114.68-17.219-161.137-47.106 8.447.974 16.568 1.299 25.34 1.299 49.055 0 94.213-16.568 130.274-44.832-46.132-.975-84.792-31.188-98.112-72.772 6.498.974 12.995 1.624 19.818 1.624 9.421 0 18.843-1.3 27.614-3.573-48.081-9.747-84.143-51.98-84.143-102.985v-1.299c13.969 7.797 30.214 12.67 47.431 13.319-28.264-18.843-46.781-51.005-46.781-87.391 0-19.492 5.197-37.36 14.294-52.954 51.655 63.675 129.3 105.258 216.365 109.807-1.624-7.797-2.599-15.918-2.599-24.04 0-57.828 46.782-104.934 104.934-104.934 30.213 0 57.502 12.67 76.67 33.137 23.715-4.548 46.456-13.32 66.599-25.34-7.798 24.366-24.366 44.833-46.132 57.827 21.117-2.273 41.584-8.122 60.426-16.243-14.292 20.791-32.161 39.308-52.628 54.253z"></path></svg> [@MortaraSara](https://twitter.com/MortaraSara) | [@SanchezTapiaA](https://twitter.com/SanchezTapiaA) <svg viewBox="0 0 496 512" style="position:relative;display:inline-block;top:.1em;fill:#A70000;height:1em;" xmlns="http://www.w3.org/2000/svg"> <path d="M165.9 397.4c0 2-2.3 3.6-5.2 3.6-3.3.3-5.6-1.3-5.6-3.6 0-2 2.3-3.6 5.2-3.6 3-.3 5.6 1.3 5.6 3.6zm-31.1-4.5c-.7 2 1.3 4.3 4.3 4.9 2.6 1 5.6 0 6.2-2s-1.3-4.3-4.3-5.2c-2.6-.7-5.5.3-6.2 2.3zm44.2-1.7c-2.9.7-4.9 2.6-4.6 4.9.3 2 2.9 3.3 5.9 2.6 2.9-.7 4.9-2.6 4.6-4.6-.3-1.9-3-3.2-5.9-2.9zM244.8 8C106.1 8 0 113.3 0 252c0 110.9 69.8 205.8 169.5 239.2 12.8 2.3 17.3-5.6 17.3-12.1 0-6.2-.3-40.4-.3-61.4 0 0-70 15-84.7-29.8 0 0-11.4-29.1-27.8-36.6 0 0-22.9-15.7 1.6-15.4 0 0 24.9 2 38.6 25.8 21.9 38.6 58.6 27.5 72.9 20.9 2.3-16 8.8-27.1 16-33.7-55.9-6.2-112.3-14.3-112.3-110.5 0-27.5 7.6-41.3 23.6-58.9-2.6-6.5-11.1-33.3 2.6-67.9 20.9-6.5 69 27 69 27 20-5.6 41.5-8.5 62.8-8.5s42.8 2.9 62.8 8.5c0 0 48.1-33.6 69-27 13.7 34.7 5.2 61.4 2.6 67.9 16 17.7 25.8 31.5 25.8 58.9 0 96.5-58.9 104.2-114.8 110.5 9.2 7.9 17 22.9 17 46.4 0 33.7-.3 75.4-.3 83.6 0 6.5 4.6 14.4 17.3 12.1C428.2 457.8 496 362.9 496 252 496 113.3 383.5 8 244.8 8zM97.2 352.9c-1.3 1-1 3.3.7 5.2 1.6 1.6 3.9 2.3 5.2 1 1.3-1 1-3.3-.7-5.2-1.6-1.6-3.9-2.3-5.2-1zm-10.8-8.1c-.7 1.3.3 2.9 2.3 3.9 1.6 1 3.6.7 4.3-.7.7-1.3-.3-2.9-2.3-3.9-2-.6-3.6-.3-4.3.7zm32.4 35.6c-1.6 1.3-1 4.3 1.3 6.2 2.3 2.3 5.2 2.6 6.5 1 1.3-1.3.7-4.3-1.3-6.2-2.2-2.3-5.2-2.6-6.5-1zm-11.4-14.7c-1.6 1-1.6 3.6 0 5.9 1.6 2.3 4.3 3.3 5.6 2.3 1.6-1.3 1.6-3.9 0-6.2-1.4-2.3-4-3.3-5.6-2z"></path></svg><svg viewBox="0 0 512 512" style="position:relative;display:inline-block;top:.1em;fill:#A70000;height:1em;" xmlns="http://www.w3.org/2000/svg"> <path d="M105.2 24.9c-3.1-8.9-15.7-8.9-18.9 0L29.8 199.7h132c-.1 0-56.6-174.8-56.6-174.8zM.9 287.7c-2.6 8 .3 16.9 7.1 22l247.9 184-226.2-294zm160.8-88l94.3 294 94.3-294zm349.4 88l-28.8-88-226.3 294 247.9-184c6.9-5.1 9.7-14 7.2-22zM425.7 24.9c-3.1-8.9-15.7-8.9-18.9 0l-56.6 174.8h132z"></path></svg> [saramortara](http://github.com/saramortara) | [andreasancheztapia](http://github.com/andreasancheztapia)